
-
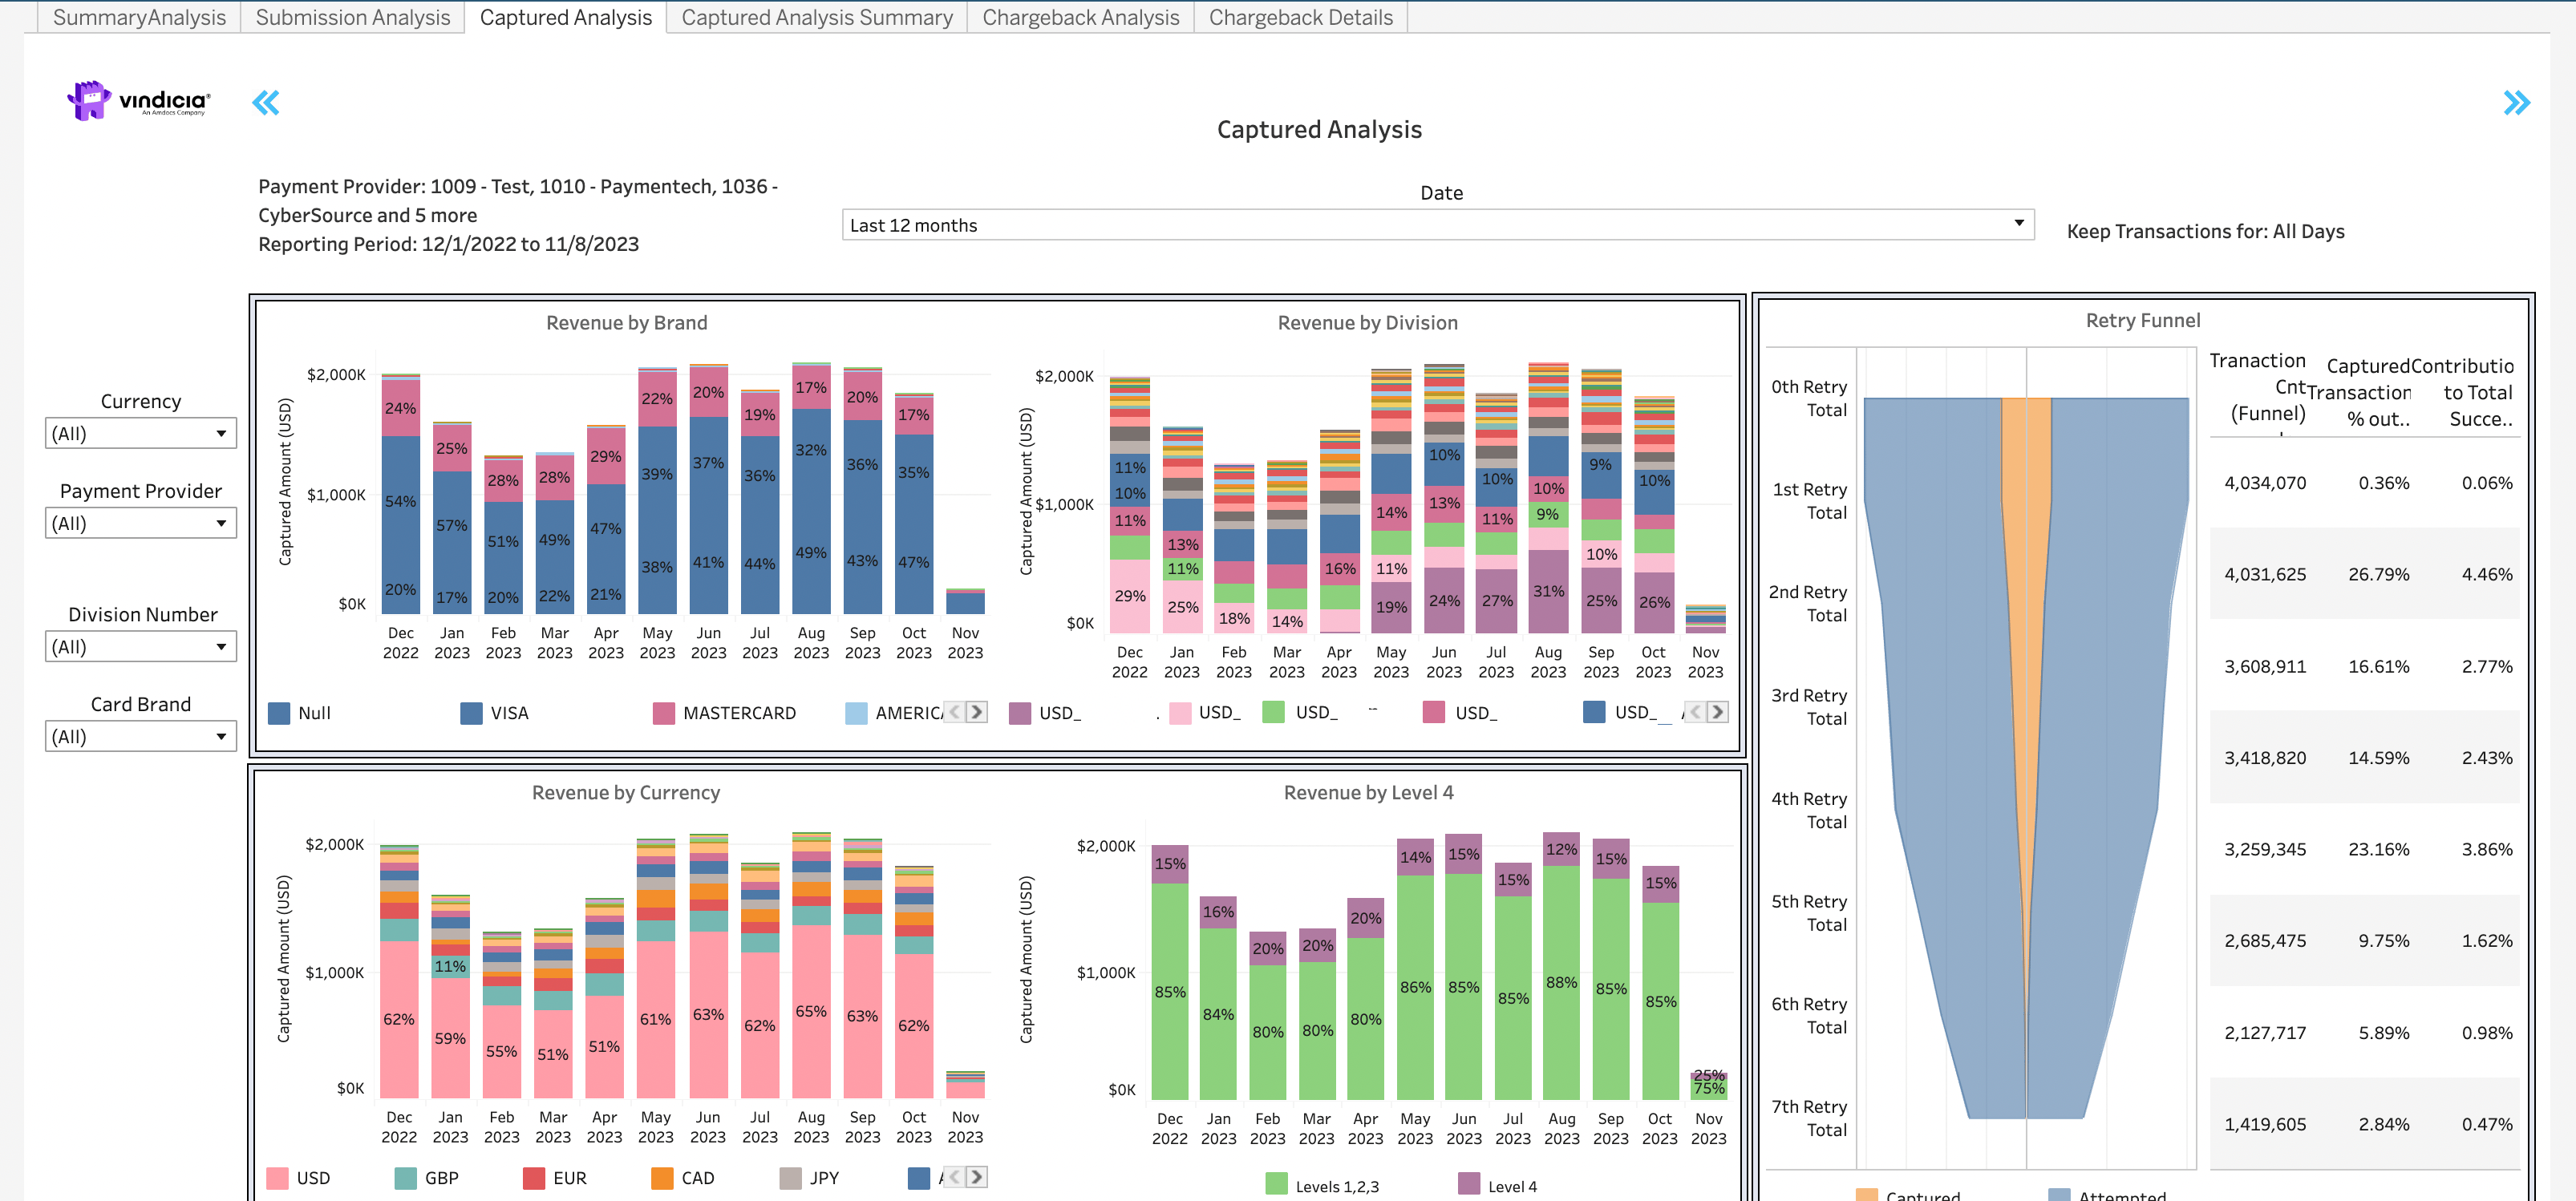
Revenue distributed by:
- Recovered Revenue distributed by Card Brand - For example Visa, Mastercard, and American Express
- Recovered Revenue distributed by Division - divisions are often used to define different countries, company divisions, or products.
- Recovered Revenue distributed by Currency - shows the recovered revenue percentages for different national currencies. Currencies are shown using their ISO three-lettered currency code
- Recovered Revenue distributed by Level 4- shows the split between revenue recovered by Level 4 processing verses Levels 1-3 processing.
- Retry Funnel displays the recovered revenue by the different the different retry attempts. The three columns near the funnel depicts the following:
-
- The number of Transactions processed in each retry attempt
- The percentage of recovered (captured) transactions per retry attempt
- The contribution of each retry to the total success rate
Directions
- Hover over any month in the graph to see a pop-up data box with the monthly details.
- Current month displays data up to date 3 days ago. Often this displays partial month revenue and so data may be lower than expected.
- For the recovered revenue by diagrams, use the arrows at the bottom of each graph to see the color-coded legend.
- For common operations such as period selector and dropdown selectors, see Common Tasks for Using the Dashboards.